For many operators, it seems like the well is a baton handed off from the drilling team to the completions team to the production team. Each group has their own tools, their own questions, and their own ideas about what makes for a quality well. But at the end of the day, the only thing that really matters is the performance of the well itself – is it producing or not?
I’ve been reading more and more articles with the same thesis: as the amount of data collected on unconventional plays increases, it can be used to build advanced analytics that drive towards successful wells. But this data only really begins to be meaningful when it is interconnected with other big data sets. True data integration across teams has an immense potential for answering challenging questions about the relationship between the decisions made at each stage of a well’s life and its performance.
In our own work with frac data at Well Data Labs, I have seen how combining data from different disciplines like geology, drilling, and completions can enable engineers to answer questions better and faster than ever before. Though this end goal of a fully integrated data analysis process may seem obvious, I know that the reality of situation is often quite different. What I have noticed is that savvy engineers are beginning to put all of the pieces together, often by pulling multiple data sets together into analytical tools like Spotfire and Tableau. By amalgamating all of their data sets together in one place, engineers are able to create a single view of their asset.
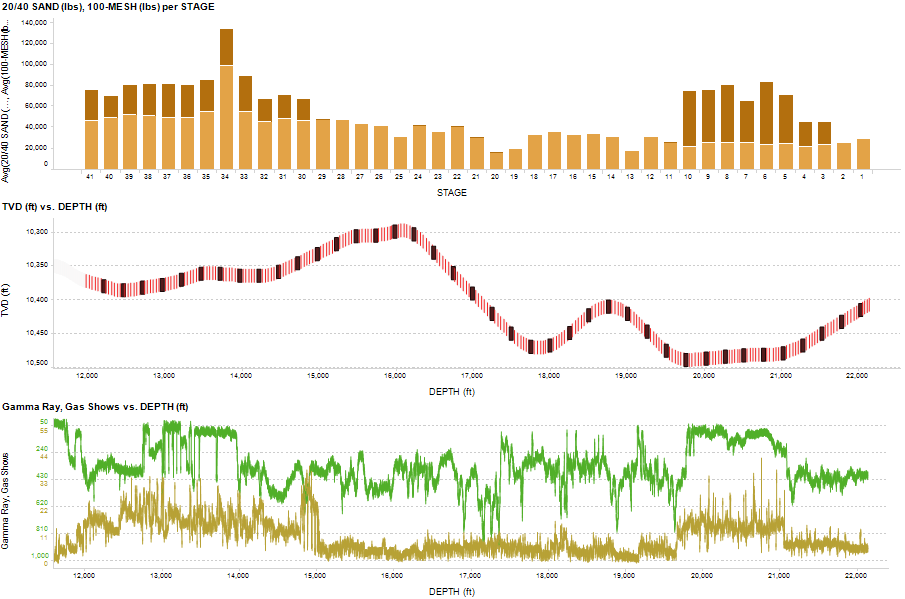
Working with a few engineers on our team here, we created an example of this type of analysis in Spotfire (image above) by combining the gamma log and wellbore data from an .LAS file, and the clean 1-second files with proppant volumes mapped by type per stage from our software. Additional information like gas shows, formation depths, and faults could also be overlaid on top of this to create a single picture of the well from design through completion.
Once engineers have access to the real data from all their wells, deep analysis can be done to look for correlations between treatment design and well performance. An engineer could look at something similar to this and immediately ask questions like: Is it possible the middle stages are not landed parallel to the formation? Were those fracture treatments not completed as designed due to operational challenges? More questions, hopefully, lead to more answers and better wells.
There’s an excellent report by Ope Amosu of GE Canada from 2016 where he suggested, “big data and analytics have the power to help oil companies fight back against the prolonged slump in oil prices.” I am convinced that in the ever increasing push for greater efficiency and better performance, the most successful E&P’s are leveraging the power of technology to plan, analyze, and report on their wells. Technical capabilities formerly reserved for the majors, requiring teams of IT professionals to implement are now available to any operator with a laptop and WIFI. Integrating data like formation, wellbore, and stimulation design “can help launch a fundamentally more effective organizational model—leveraging technical and cross-functional expertise” and enable “better vertical and horizontal decision making.” – Andrew Steinhubl, “Unleashing Productivity: The Digital Oilfield Advantage.”