• Sign In
Well Data Labs
  • Drilling
    • Overview
    • Platform
  • Completions
    • Overview
    • Platform
    • Real-Time Frac
    • Machine Learning
    • WDL for Service Companies
    • Wellview Add-In
    • FAQs
  • ESG
    • Overview
  • Services
    • Fracture Diagnostics
    • Other Services
  • Company
    • About
    • Careers
    • Partners
    • Contact
  • Blog
  • Request Demo
Select Page
Visualizing the Big (data) Picture

Visualizing the Big (data) Picture

by Mike Raubach | Nov 29, 2017 | Data Science, Industry Insights

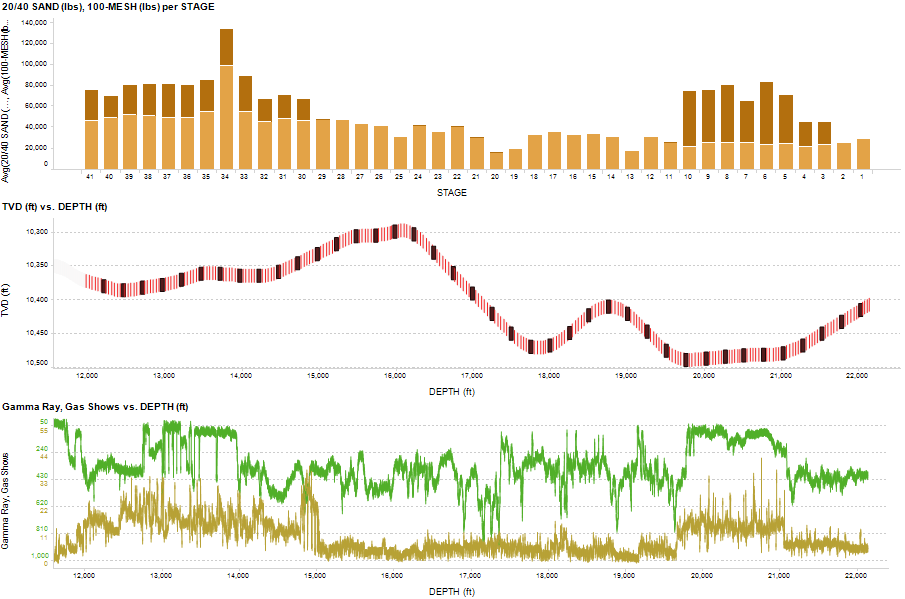
For many operators, it seems like the well is a baton handed off from the drilling team to the completions team to the production team. Each group has their own tools, their own questions, and their own ideas about what makes for a quality well. But at the end of the...

Recent Posts

  • 3 tools you need to enable real-time completions decisions
  • Well Data Labs Announces Partnership with Ubiterra
  • 5 tips to improve your data visualizations with color
  • Got casing deformation? Have you looked at your frac data?
  • Drilling in on drilling data – faster insights without the wrangling
  • How to make the most of Sealed Wellbore Pressure Monitoring and Offset Pressure Analysis: a guide to two fracture diagnostic options
  • The PPE (Passion-Perseverance-Expertise) you need for a career in oil and gas

Archives

Categories

  • Careers
  • Completions
  • Data Analytics
  • Data Integration
  • Data Science
  • Drilling
  • Fracture Diagnostics
  • Industry Insights
  • IT
  • Machine Learning
  • News
  • Real-Time Frac
  • Spotlight Series
  • Uncategorized
  • Drilling
  • Completions
  • ESG
  • Services
  • Company
  • Careers
  • Contact

STAY CONNECTED

Sign up for our newsletter

Privacy Policy | Sitemap            © 2022 Well Data Labs. All Rights Reserved.