Automation, artificial intelligence, AI-enabled, machine learning – these words have become a part of our vernacular. And, when it comes to enhancing how we live and work, the possibilities are boundless. The Apple Watch, for example, has an app that checks for changes in heart rate. If it detects something out of the norm, it sends an alert to the doctor and patient enabling them to make informed and timely decisions about the care or action needed.
Turning to completions operations, using technology to automate manual tasks such as selecting stage start and end times can greatly benefit workflows, operational efficiencies, and decision making. First, it frees workers up to focus on higher-value, higher-impact tasks. And when adding real-time data, it can also arm teams with timely information and alerts about potential problems so they can make more proactive on-the-fly decisions.
Flagging stage start and end times with machine learning
This blog post summarizes the second technical paper we presented at URTeC this year, Robust Event Recognition in Real-Time Hydraulic Fracturing Data for Live Reporting and Analysis. The paper, URTEC-2020-2782-MS, describes a machine learning model we developed to identify and flag stage start and end times. While that may seem rather rudimentary, when you factor in the magnitude of data from zipper fracturing operations with multiple wells and crews, add in real-time streaming data, plus the approach we used to develop the algorithm is, in our humble opinion, really cool.
So what inspired this? For starters, manually setting each flag for each stage of each well is frankly tedious and may not always be accurate or consistent – no matter how much experience the person has. What can take a human between 20 and 40 minutes per well can be done in a mere 5 to 10 seconds with automation. Hmm, multiply that by several wells, and you can see the time savings.
Second, accurately and consistently flagged stage start and end times enables real-time reporting of important stage metrics, including average pressures, rates, and concentrations. Additionally, consistency facilitates even more advanced analysis by allowing for real-time stage comparisons aligned on flagged events such as starting each stage, achieving target rate, and breakdown.
Now, let’s look at the approach we used to develop the algorithm. What makes this novel is it is the first time signal processing was applied to identify key hydraulic fracturing events in a real-time data stream.
Mimicking a subject matter expert
Without going into too much detail (download the paper to learn more), the algorithm starts by focusing on the salient features and patterns in the signal. As anyone who has worked with real-time frac data can attest to, the raw signal data is noisy! For that reason, we start the game by reducing the data resolution to improve the outcome using our signal processing approach. You read that right; the algorithm starts by reducing the resolution of the signal. While that seems counterintuitive, it works! Instead of focusing on being precise off the bat, the model first gets close and then quickly fine-tunes using the original high-resolution signal to get even closer. This is much more akin to the approach a subject matter expert would take. Think of it as zooming out to see the big picture and then zooming back to the relevant regions before focusing on the details. In this way, too, the model is mimicking how a human would approach the task.
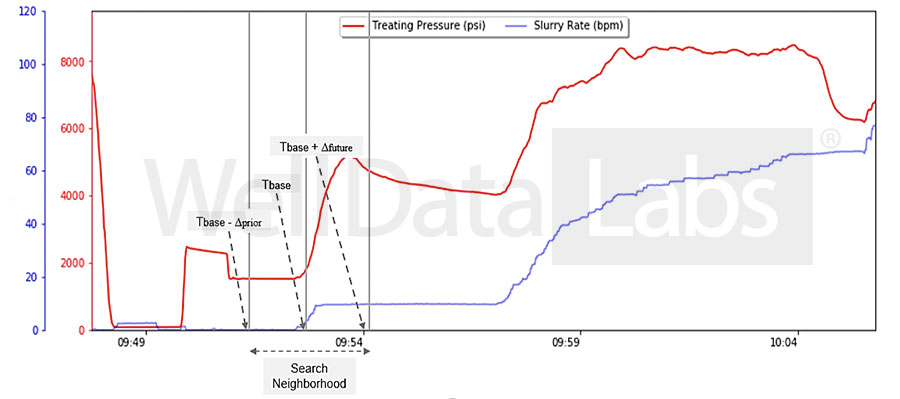
Finding stage start time by zooming into the search neighborhood
No black box here
Adding to the cool-factor is the fact that the decisions this particular AI model makes are transparent and easily explainable. And the tangible results are speed and accuracy. Manually flagging all events on a typical two-well zipper frac with 60 stages each would take approximately four hours. In contrast, the model can predict events for the whole stream (~210 hours) in less than a minute. And, the model was able to recognize 97.8% of the labeled flags overall. Drilling into the errors on the recognized events, 99% of the predictions were within five seconds of the manual pick. It is also worth noting that the model’s flags are even more precise than the average manually selected flags because, really, who spends the extra time to zoom in on a treatment plot to get the flag precisely placed.
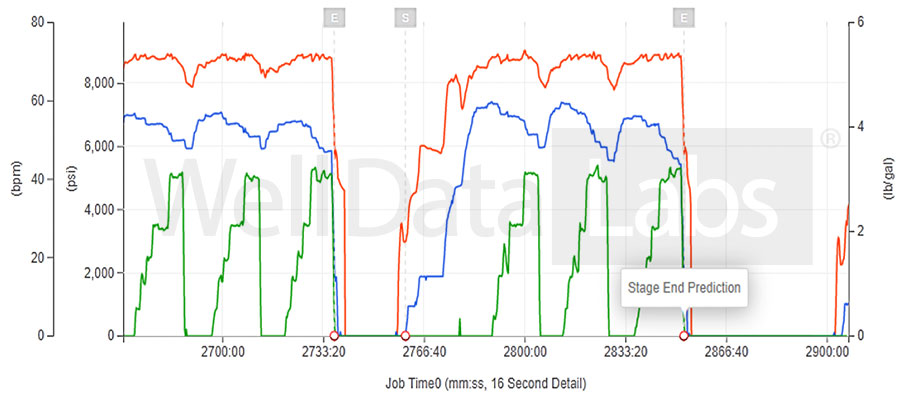
Real-time moving windows
To download and read the full paper, please visit OnePetro. If you would like to see this or our other machine learning models, called Power-Ups™ in action, contact sales@welldatalabs.com.