Machine learning allows us to automatically place event flags across an entire job, instantly. This post will explain how flags generated automatically by Well Data Labs Power-Ups™ can be used to investigate five different operational efficiency indicators.
A quick refresher – what is machine learning?
Machine learning gives computers a framework to do what comes naturally to humans: learn from experience. A machine learning model is an algorithm that ingests data, finds patterns in that data, and produces a prediction. If you want to read more about machine learning and how it applies to frac data, see part 1 of this series.
Based on historical data, machine learning models are trained to recognize events in high-frequency time-series frac data. This automation saves time and brings consistency across stages, wells, service companies, and operators. Engineers and executives can use these predictions to refine their operational efficiencies and increase the ROI of their completions designs.
How can machine learning help with completions?
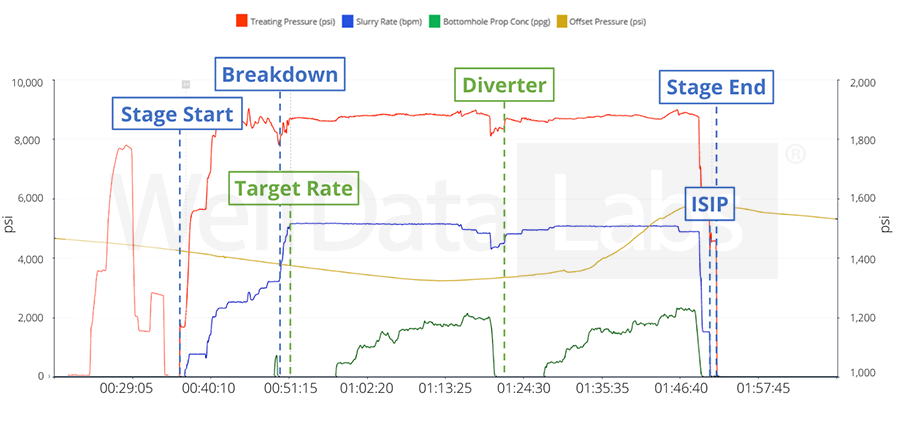
Well Data Labs provides machine learning with a selection of Power-Ups designed to solve everyday problems. Power-Ups are machine learning models that recognize events in high-frequency time-series frac data. These predictive models include stage start/end, breakdown, ISIP, Diverter, and target rate. For the analysis in this post, I used the following Power-Ups:
Stage Mappings Power-Up – a collection of three predictive models:
Stage Start/End – places a flag when pumping begins (after a pressure test, if present) and ends once pumping has ceased
Breakdown – places a flag when pressure increases near the beginning of a stage while the slurry rate is nearly constant
Instantaneous Shut-In Pressure (ISIP) – places a flag at the final injection pressure minus the pressure drop due to friction in the wellbore and perforations or slotted liner
Target Rate Power-Up – places a flag when the slurry rate has stabilized
Diverter Power-Up – places a flag when the Diverter reaches the perforations
5 ways Power-Ups can improve the ROI of completions designs
1. Time to target rate
Some formations are more difficult to fracture, and some designs call for an increase in rate at different speeds. All totaled, the time to reach rate on a given well results in a significant cost. The time to design rate can be used to compare treatment efficiencies and identify trouble stages across different formations, frac crews, and designs.
The scatter plot feature in Well Data Labs allows you to plot the time difference between flags placed by our machine learning (ML) models. Here I look at the difference between the stage start time and the time at which target rate was reached.
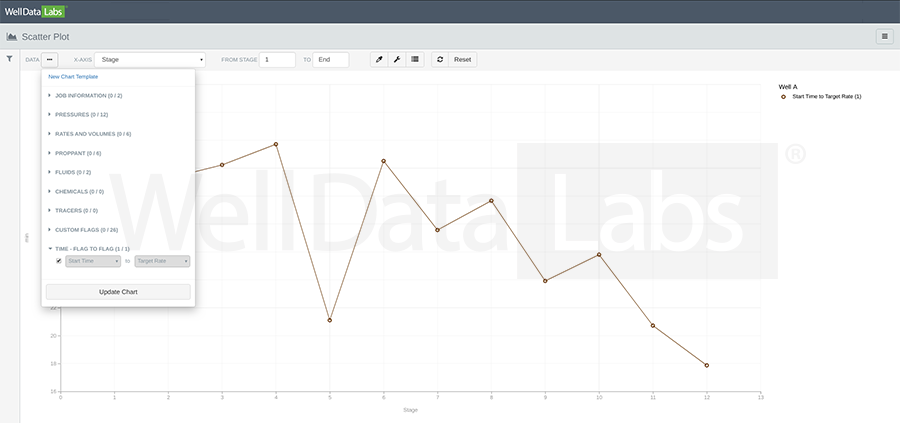
In looking at the data this way, I can start to see trends across my stages.
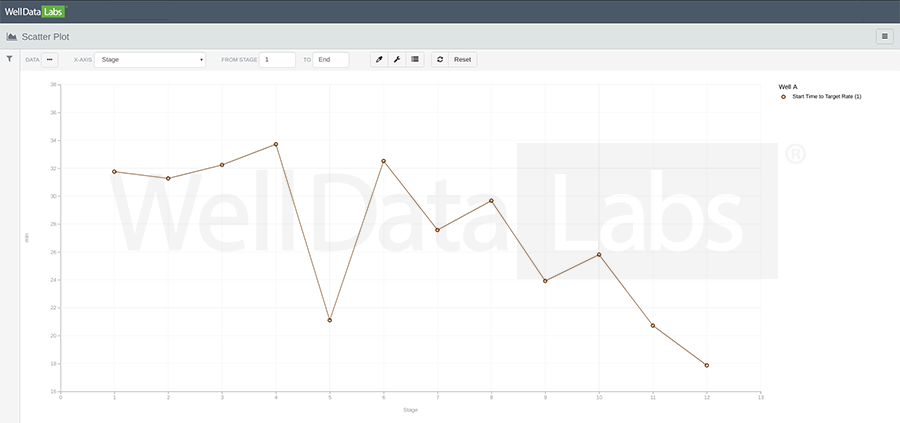
Stage 5 reached target rate more than 10 minutes before stage 6. Achieving just a 10-minute savings per stage on a 50-stage well can result in significant cost savings. Furthermore, variations in time to rate on a stage-by-stage basis (accounting for decreasing tubing volume along the lateral) can be used to quickly identify difficult stages. Large variations might indicate equipment problems, for example, pump, blender or proppant delivery issues.
2. Time from opening wellhead to ball seat
There are two applications for the Breakdown Power-Up, which can help quantify operational efficiencies. The first application is the incremental time and fluid cost to seat the ball. There are two basic types of frac plugs: flow-through plugs that require balls to be pumped down to seal it and prevent fluid from entering the previous stage, and plugs with the balls in place, which are more expensive but save time and fluid. If the design is flexible, the choice between flow-through and in-place plugs can be simplified by looking at the average difference in time (and extrapolating fluid cost) between stage start and breakdown.
Here I use the Scatter Plot feature in Well Data Labs to plot the difference between the stage start time and breakdown.
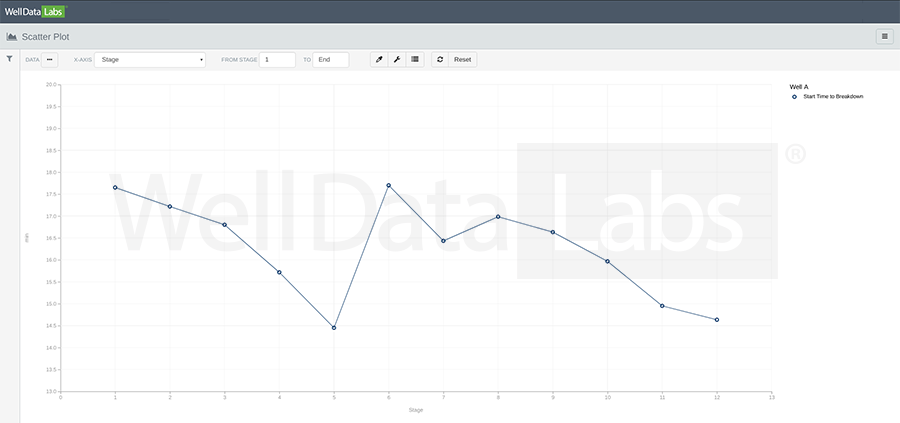
I can see that the time it takes to seat the ball varies between 14.5 and 17.5 minutes. This information might help me choose to spend more upfront for in-place plugs, but save money on time and fluid.
I also see a significant time difference between stages 5 and 6, amounting to nearly 3 minutes of extra fluid and fuel on this stage alone. This gives me pause, because as the time to breakdown becomes longer, the pressure at which breakdown occurs becomes larger. This leads into the second application for the Breakdown Power-Up, which can help quantify operational efficiencies: the stage variance of the breakdown pressure.
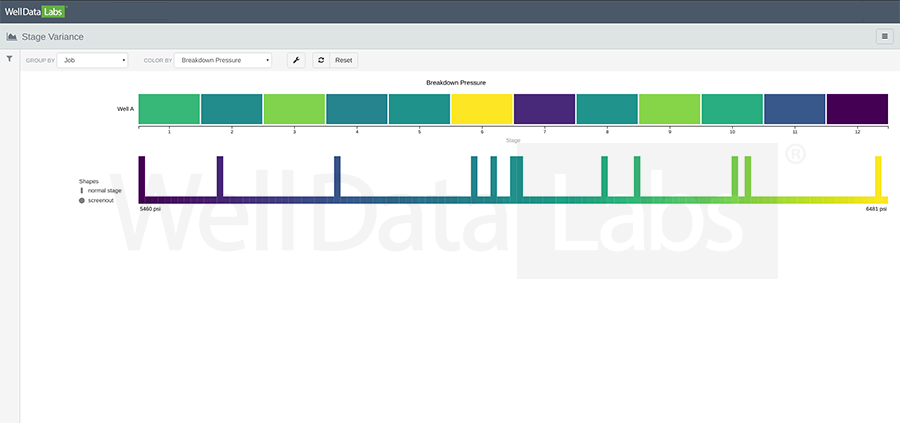
We see that the breakdown pressure for stage 6 is more than 1000 psi higher than stage 7. High breakdown pressures may be indicative of poor perforation efficiency or that the stage being treated is outside of the target interval.
3. Time to pump and seat the diverter
There are two applications for the diverter Power-Up, which can help quantify operational efficiencies. The first is the incremental time required to pump and seat the diverter.
Here I use the Scatter Plot feature in Well Data Labs to plot the difference between the stage start time and diverter reaching the perforations.
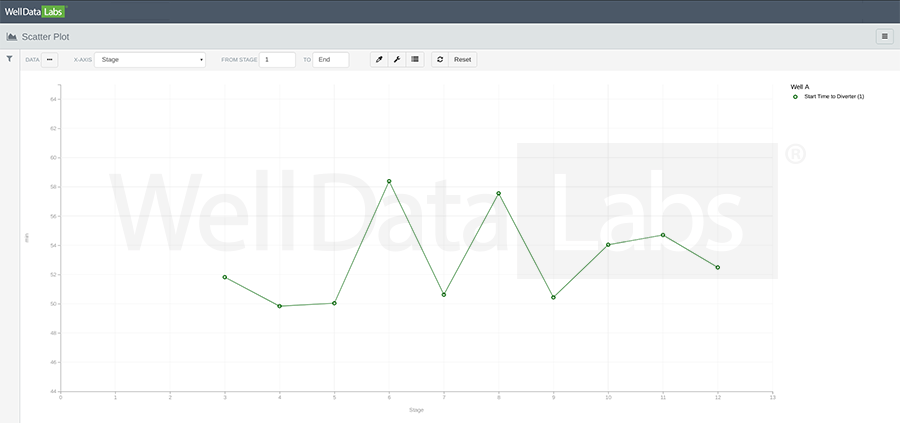
Diversion operations were only performed in stages 3-12, and it took almost 10 minutes longer to pump and seat the diverter on stages 6 and 8. Again, this amounts to higher fuel and fluid costs.
4. Change in Pressure from Diversion
The second application for the Diverter Power-Up is the identification of the pressure increase (△P) due to diversion.
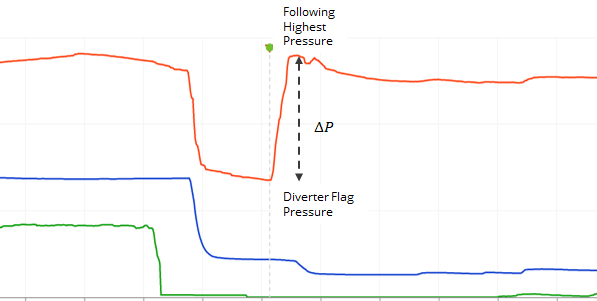
Here I use the Scatter Plot feature in Well Data Labs to plot the treating pressure when the diverter seats and the maximum treating pressure following the diversion operation. The difference between these two flags is the △P-value
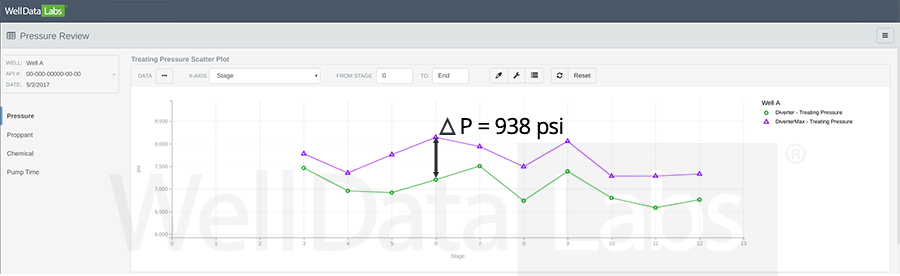 Remember that stages 6 and 8 took much longer for the diverter to reach the perforations. Furthermore, the diversion operation on stage 6 resulted in the highest △P (938 psi). Excessive △P’s can cause possible screen-outs in the short term and tubing fatigue in the long term; both issues can significantly affect operational efficiency.
5. Stage Comparison
Finally, we can look into general trends across all of our stages. The stage comparison plot allows me to overlay all of my stages and align each stage on a Power-Up flag (I aligned on diverter, but any custom flag can be used).
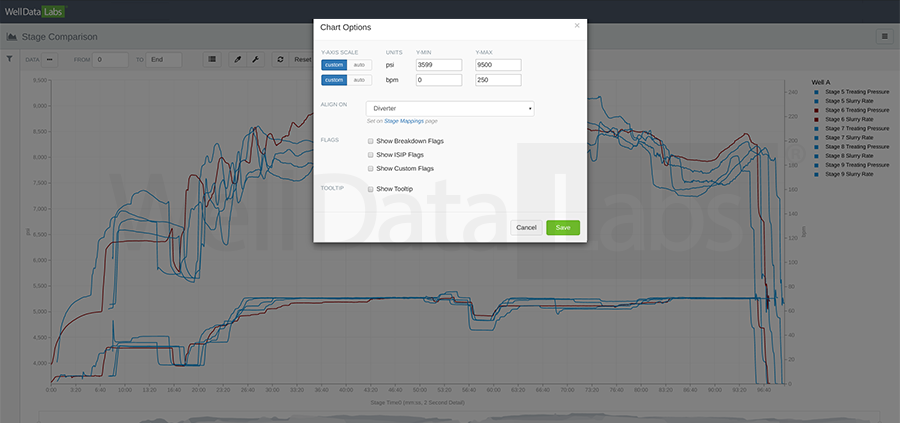
When a stage has multiple proppant ramps, diverter on perforations is a useful point to align the various cycles to demonstrate the effectiveness of the various diverter drops.
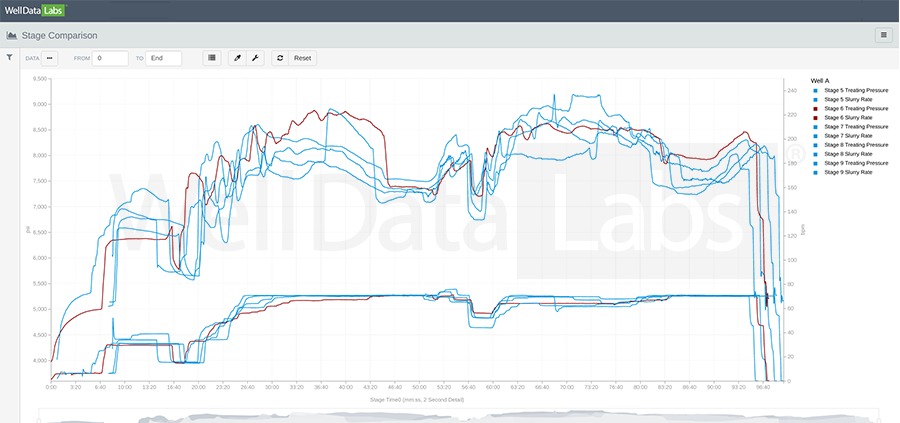 This stage comparison plot confirms that stage 6 was treating at a much higher pressure before diversion and took longer to reach target rate. Furthermore, following the diversion operation (which resulted in an abnormally large △P), the stage continued to treat at a high pressure despite the rate being lowered.
Conclusions
Using Power-Ups and Well Data Labs reporting tools, we identified a cumulative loss of nearly 30 minutes on stage 6 alone, arising from difficulty in breaking down the formation, reaching target rate, and seating the diverter. Moreover, we found high breakdown pressures, which might be indicative of poor perforation efficiency. Finally, we found where diversion operations resulted in an excessive △P. This can cause possible screen-outs in the short term and tubing fatigue in the long term; both issues can significantly affect operational efficiency.
Identifying design and equipment shortcomings can equate to significant cost savings in all areas of completions design, from time-savings during the job and after. Furthermore, harnessing the power of machine learning to consistently control for multiple design variables allows engineers to make informed decisions, from plug choices to diversion operations and beyond.