Using frac data to spot trends and improve outcomes
Though the booms and busts of the industry are often tied to economic and geopolitical forces beyond our control, we at Well Data Labs are firm believers in taking advantage of these slowdowns to innovate and improve efficiencies. Well Data Labs was founded during the last oil price bust of 2014, and our fearless co-founder and CEO, Joshua Churlik, does not let his employees forget this fact! I think it’s because it’s a great source of pride, but also because there is a great lesson to be learned in the oil & gas industry from our company’s origin story.
In times like these, we have more time to focus on creatively solving some of the unique industry challenges that exist. This is exactly what occurred in 2014 and 2015. The industry responded to the lower prices by refining their techniques, developing new technologies, and reducing operating expenses by learning to drill and complete wells at a lower cost.
One example to initiate an operational efficiency project is to look back at your historical wells. There are a lot of straightforward cost savings that can be achieved by simply learning from your old data to inform future decision-making.
“If you can’t measure it, you can’t improve it.” Peter Drucker
If you’re a smaller operator, access to a robust, normalized dataset of dozens of wells can create a valuable opportunity to identify and establish completions design best practices. And, for larger operators, having access to hundreds of historic wells in the same fashion can create immense value, allowing the opportunity to develop statistically significant KPIs and targets that can be applied in each operating basin.
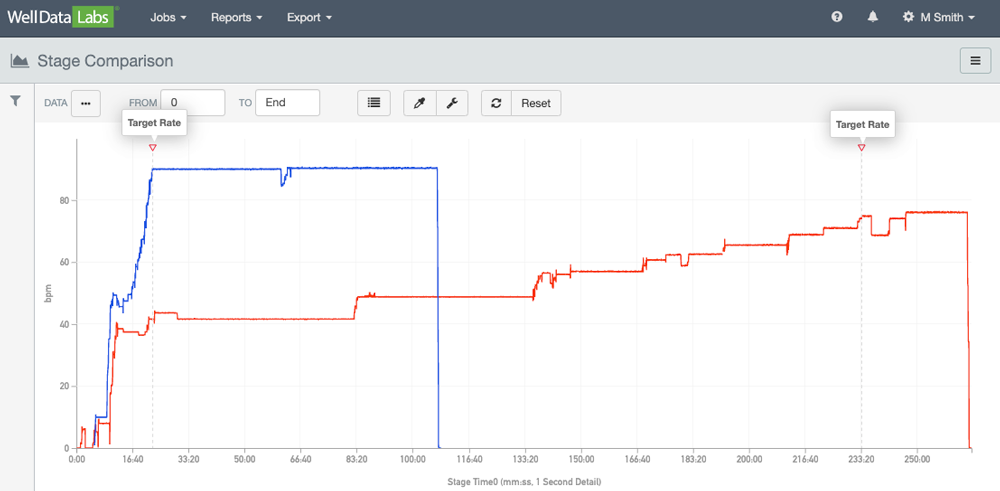
An example of this type of project that one of our customers was able to achieve was in the development of a Time-to-Rate KPI, which translated to ~$190k in operational savings per week.

Analyzing past wells lets you know whether or not you are headed in the right direction for future planned wells. In the example shown above, the difference in time for these two jobs is ~211 minutes (measured between the two target rate flags). On a 50 stage well, achieving rate quicker would result in a total of ~175 hours saved (50 stages x 211 minutes).
Three more reasons why you should analyze your old data if you’re not already doing so:
-
- Identify patterns and trends to predict future results
- Avoid making the same mistakes
- Build on past successes
“What if we don’t have a lot of historical data already uploaded to Well Data Labs yet?”
Have no fear, the Well Data Labs Team is here! We’d be happy to work with you on getting a project like this off the ground. WDL can help provide the clean flow of data while you focus on the analysis that is impactful to your well design and success.
As the world becomes more reliant on technology, we understand the vital role our company plays in connecting you with your data. We’re always here to help you push through any roadblocks that are preventing you from extracting maximum value out of your data.
How can we help?
If you or your team has been tasked with historic data loading or if you could use help with anything from data quality and control to creating a consistent daily completions report let us know. Our team now offers a variety of services, including historic data loading, daily completions reports, completions QA/QC, custom integrations, and personalized training. With each of these services, you’ll get hands-on help from subject matter experts that will provide knowledge transfer and best practices.
For more information about our Professional Services, or if you have a need not covered above, send us an email or give us a call at (720) 662-7771. Let us know what we can do to help you!

