At the most basic level, hydraulic fracturing’s main objective is to fracture the rock to stimulate the flow of hydrocarbons. When completion engineers design a frac job, their priorities are to optimize that flow while adhering to operational, budgetary, and reservoir development constraints to maximize well performance and economics. Of course, it is much more complicated than that, and looking to the past can provide context and a better understanding of performance, which can be applied to the future. Such is the case with hydraulic fracturing data.
The completion design process is somewhat trial and error. Data from previously completed wells are often used to predict future well performance. For instance, baselines for materials, volumes, and pumping schedules that are established from past frac jobs that delivered a well with above-average performance can be applied to new fracture treatment designs. While reviewing past frac designs can provide valuable insights into future performance, analyzing the vast amount of data can be overwhelming. Frac data may have been collected over many years and may exist in many different formats and varying degrees of quality. Given the amount and quality of the data, where does one start? And more importantly, what is to be gained?
In this blog post, we briefly distill one of the two papers we presented during URTeC 2020. This paper describes how our Completions and Machine Learning platforms were used to extract a pumping schedule from hydraulic fracturing time-series data with 96% accuracy. Leveraging techniques from digital signal processing, the automation proved to be consistent, accurate, robust, transparent, and fast. Again, this is a summary of some of the key techniques described in the paper. To read the entire study, please visit One Petro to download the paper.
Data source
Machine learning needs data – and a lot of it. Because Well Data Labs has collected over half a million stages of completion data, we were able to leverage that resource to analyze the data from wells in different formations across North America. For this study, we trained and tested our data on a large variety of stages covering several different operators, formations, frac fluids, completion systems, and treatment designs. Using a diverse set of treatment data increases the odds that the models will generate accurate predictions on new data.
Lean in and start simple
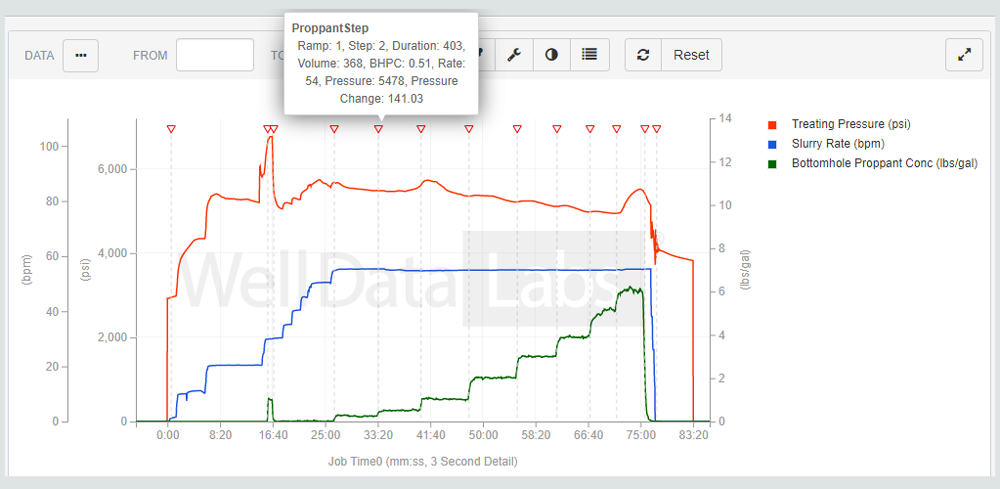
Using ideas inspired by the lean startup methodology, we built our models iteratively in small steps while incorporating feedback from our subject matter experts. Our models were trained on 112 stages of data and tested on the remaining 465 stages. Rather than building one model that recognized all of the pertinent events in a pumping schedule, we broke the process down to identify the boundaries of various sections of the pump schedule. Using these events as boundaries, the final model calculated the summary statistics at each step (pad, acid pad, slurry, sweeps, and flush).
For more detailed information about each of the models, download the paper here.
Data prep
With any big data analysis, automation, or model building process, the importance of data quality cannot be understated. Before analysis can begin, it is crucial that data is organized chronologically, deduplicated, and any missing data are handled appropriately. Using the Well Data Labs Completions platform ensured the data was primed and ready for analysis.
Data filtering and signal processing
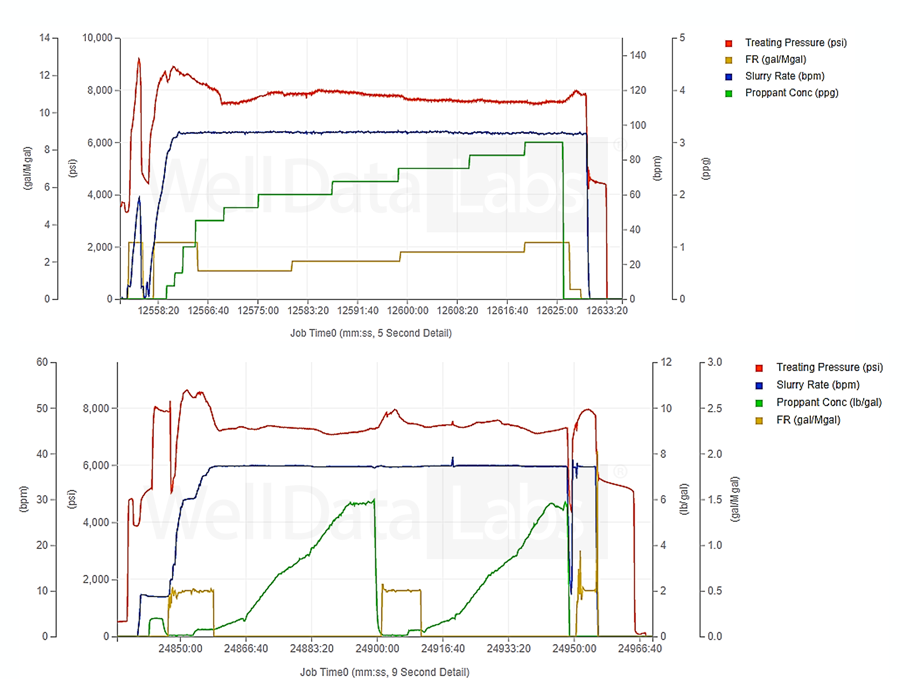
The unifying high-level idea of our model was to transform the raw signal, using signal processing techniques, into new signals that captured the most relevant aspects of the problem. By smoothing, normalizing, and then quantizing the proppant concentration signal, our machine learning model can accurately flag start and end times of various sections of the pump schedule (pad, acid pad, slurry, sweeps, and flush). Intuitively, the model first isolates sustained intervals with positive proppant concentration to identify acid pads and proppant ramps. The remaining time intervals, along with the stage boundaries (start/end), are then associated with pads, sweeps, and flushes. By applying these signal processing techniques coupled with machine learning rules, we effectively mimicked a domain expert’s process for identifying these key events. The result is an automated process with picks that can be easily explained.
Conclusion
Hydraulic fracturing time-series data analysis is a natural fit for signal-processing techniques. Our model correctly identified 96% of flags. Of those flags it correctly identified, 95% of the model’s picks were within three seconds of the subject matter expert’s picks. This workflow automation significantly reduced time and enabled swift auditing of existing picks compared to manual processes, thus further proving its efficacy in analyzing historic pumping schedule data. But it isn’t perfect. One limitation of the models is the lack of context that only a subject matter expert can provide. Machine learning may remove inefficiencies, but it needs subject matter experts who can provide the core knowledge and expertise. Oil and gas data is highly complex, so it is critical to foster very close collaboration between the subject matter experts and the data scientists.
Optimizing fluid composition – chemical costs can be reduced by optimizing FR loadings while maintaining a level of caution to prevent screen outs. Historical data can be used to identify regions where it is possible to run lower FR concentrations.
Sources
- Historic Fracture Design Evaluation Made Easy: Automating Pumping Schedule Recognition from Hydraulic Fracturing Time-Series Data, URTEC-2020-2797-MS; Jessica Iriarte & Samid Hoda, Well Data Labs; Source: SPE/AAPG/SEG Unconventional Resources Technology Conference, July 2020
- Leveraging Cloud-Based Analytics to Enhance Near-Real Time Stage Management, SPE-199735-MS; Peter Bommer, Abraxas Petroleum & Jessica Iriarte, Well Data Labs; Source: Society of Petroleum Engineers, October 2019