
Your completions data, doing more with less.
Well Data Labs is an affordable completions data pipeline that takes your frac data, consolidates and normalizes it, and turns it into a usable data resource for analytics, AI and everyday decision-making.

Well Data Labs Completions Platform

Transform Messy Data into Decisions
Turn job and stage data into engineering-level analysis, uncover trends, compare performance, and identify outliers.
Standardize Any Data
Frac data rarely arrives in the same format. Well Data Labs standardizes inconsistent data into one consistent structure, regardless of how it comes in.

Optimize Cost and Efficiency
Compare costs, efficiency and vendor performance across jobs to uncover savings opportunities and support commercial negotiations.

Integrate With Your Tools
Use APIs and integrations to bring standardized data to the tools your team already relies on such as WellView, WITSML, Spotfire, Power BI, Snowflake and Databricks.
Your Completions Agent – ChatWDL
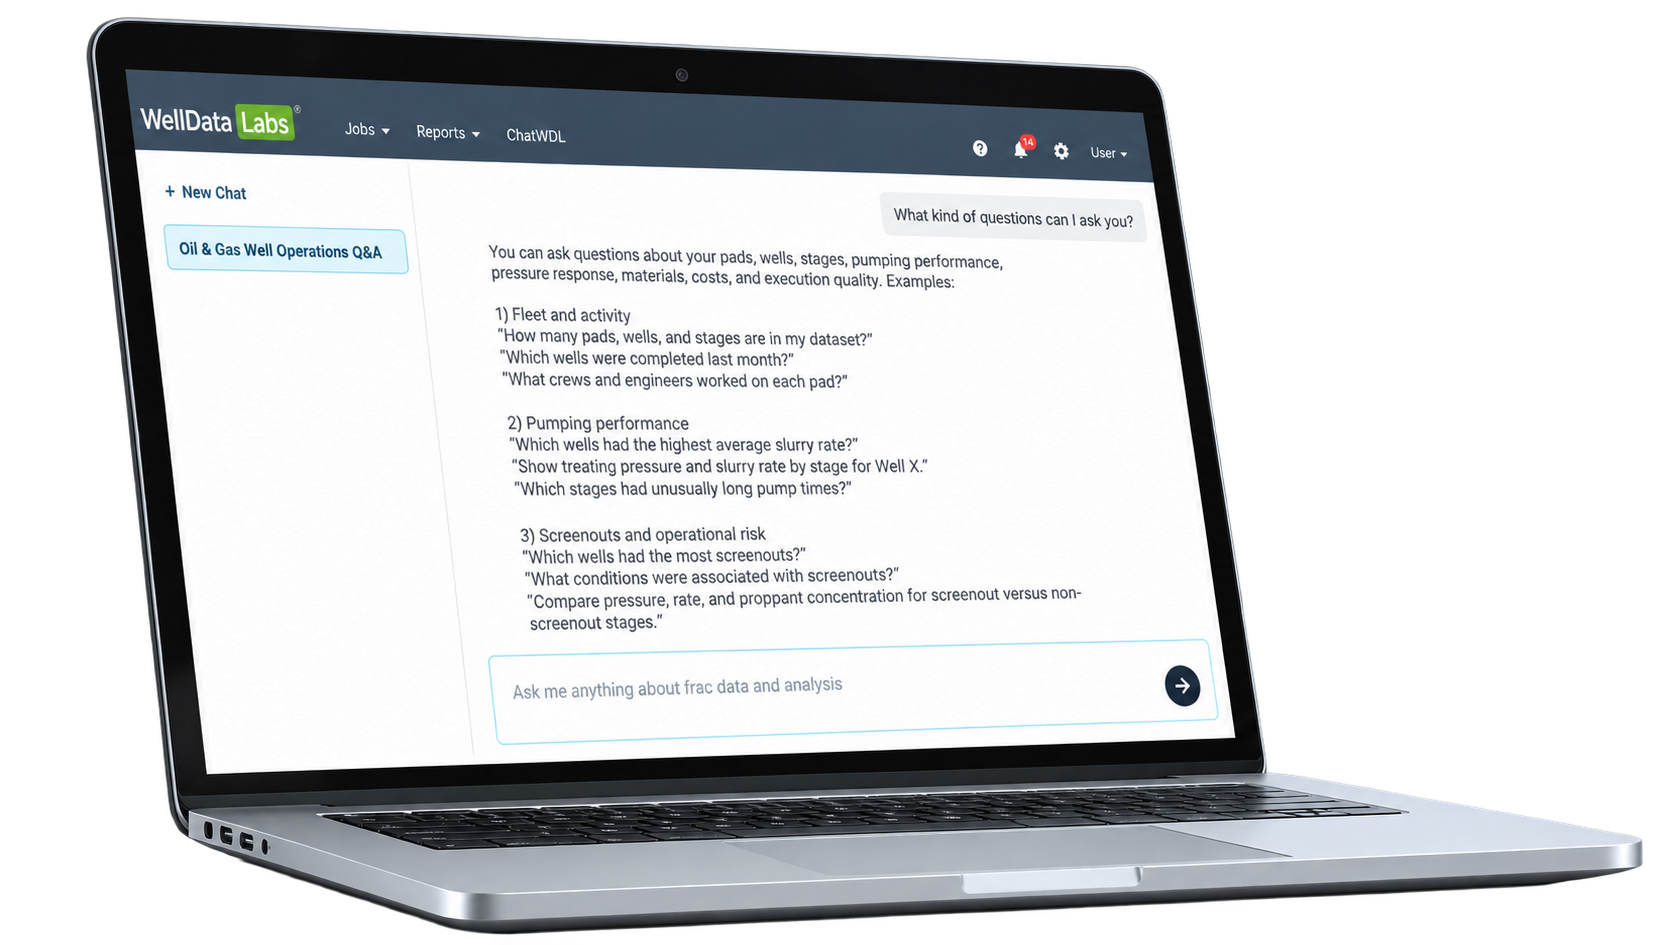
Ask questions about your data
Ask questions in plain language instead of digging through spreadsheets or building queries.
Find problem stages faster
Ask ChatWDL to identify outliers in pressure, rate, pump time, cost, proppant, or other completions metrics.
Create graphs instantly
Turn your data into stage variance graphs and other visualizations simply by asking.
Get oilfield-specific answers
ChatWDL is built specifically for oilfield data and analysis, so it understands the terminology and context behind your completions data.
Powerful Tools. Built In.
Put your completions data to work with powerful tools built for the way engineers work.
Automated QA/QC and fast onboarding (drag-and-drop or API), eliminates manual file cleanup and accelerates time-to-value.

Well Data Labs Power-Ups® auto-detect key events (ISIP, breakdowns, screen-outs, rate/target flags) and generate structured stage summaries.
Multi-Well Timelines, Stage Variance heatmaps and Stage-overlays allow for root-cause analysis and visual debugging of operations.
Designed for Frac
Use your Offset Pressure and SCADA monitoring data for low-cost, high-resolution detection of frac interactions and VFR metrics.
Historic frac curves (P10/P50/P90) and stage comparison tools are perfect for benchmarking and spotting outliers quickly.
Pad Cost and efficiency analytics (cost/stage, stages/day, pump time, vendor/crew comparisons) tied to machine learning flags support commercial negotiations.
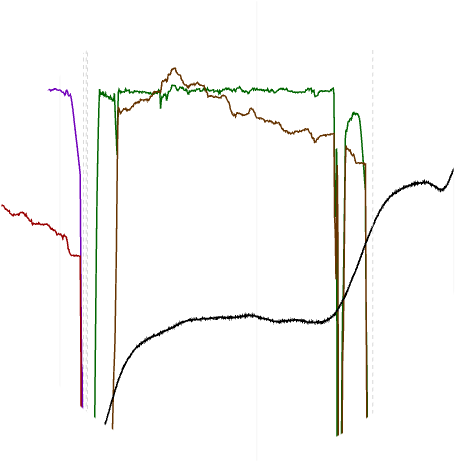
The math is simple. One better decision covers it.
Start your Completions Analytics Platform subscription for as low as $5 per stage.
| Legacy Approach | Well Data Labs | |
|---|---|---|
| Data foundation | ||
| Data normalization | Hand-cleaned, vendor by vendor | ✓ |
| Automated QA/QC | Spot checks; errors found late | ✓ |
| Well & stage organization | Folders and naming conventions | ✓ |
| APIs (inbound/outbound) | Emailed files and sharefile uploads | ✓ |
| Analytics & AI | ||
| Completions analytics | One-off spreadsheets per engineer | ✓ |
| Data visualization | Charts rebuilt for every job | ✓ |
| ChatWDL access | Ask an analyst and wait | ✓ |
| MCP access | Data your AI tools can't reach | ✓ |
| Power-Ups®ML models that auto-detect key events in time-series data | Events picked by eye, stage by stage | ✓ |
| Service | ||
| Training & support | Tribal knowledge | ✓ |
| Price | Engineer hours + costly errors | as low as $5 per stage |