The end of the year is coming – you can’t avoid it! Dissecting your 2019 business data, regardless of what industry you’re in, is crucial for a strong start in 2020. By now, you’ve most likely evaluated the past year’s performance and are finalizing budgets and plans for the coming year – tapping into as many insights as you can, whether that be from financial, operational, sales, marketing, or other data. Businesses often look to these analytics to set goals with a focus on driving growth and streamlining processes to help improve operational efficiencies in the year ahead.
Year-end reviews are nothing new. Still, the way companies use the ever-increasing amount of data, the speed at which data is available, and the tools and technologies at their disposal, have dramatically improved what can sometimes be a slog.
Any of those same techniques used for year-end reviews can be applied to your completions data. If you’ve been tracking your fracs throughout the year, now is a great time to take a step back, change your perspective, and look at the bigger picture. There’s a lot you may discover from zooming out and looking at your data from a different point of view. Hopefully, you spot trends and gain deeper insights to make smarter, data-driven decisions.
While training users on the Well Data Labs platform, I like to use their frac data to showcase the reporting tools to identify trends or anomalies in their data. Quite frequently, customers ask for a review of specific pads with optimal data and avoid the data from problematic or costly wells. This strikes me as a learning opportunity. It’s certainly valuable to review successes to understand what went right, but it is equally vital to dissect data from problematic wells to make additional improvements. Problematic stages, such as screen outs, can easily be identified as outliers, and in my opinion, is some of the more interesting data to look at to help improve operations!
Embrace the outliers
To establish asset-level trends and identify outliers in your frac activity, utilizing a single data repository platform like Well Data Labs is crucial. The platform facilitates clean, structured data, built-in analytical tools, and the ability to organize data by stage, well, pad, formation, asset group, and/or service company as well as summarize multiple jobs by filtered info – annually, quarterly, and monthly totals.
The industry is always striving toward continued improvement of completion design parameters to drive well performance and returns. As demonstrated by one operator, streamlining day-to-day decision making using frac data analytics helped highlight a significant disparity and saved the company roughly $400,000.
Using the interactive multi-job and multi-stage analysis tools during completions of two multi-well pads, the team identified a significant difference in the amount of friction reducer being used on each pad. Because data was being uploaded stage-by-stage into Well Data Labs as the job was being pumped, the completion engineers were able to identify the source of the disparity, and correct course with over 100 stages remaining. In being able to make a quick and accurate mid-pad design change using Well Data Labs, the company saved nearly 400 gallons of friction reducer per stage.
This is just one example and as you consider your 2019 review – or any other analysis regardless of the time of year – there may be a plethora of questions to ask yourself, including: are slowdowns or days with no pumping time accounted for? How much total proppant or chemicals did you use throughout 2019 compared with previous years? Do these totals match what was invoiced? Are there any anomalies with treating pressures or slurry rates throughout the year? As you analyze your data in Well Data Labs, here are a few tools you might find useful.
Spot anomalies using reports like Pad Review for pump time charts and metrics for each pad,
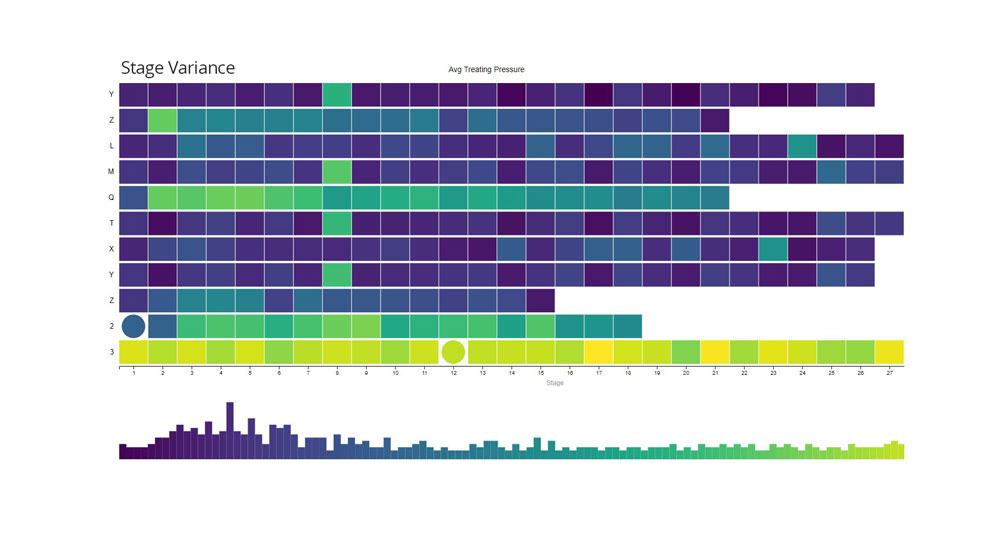
Stage Variance utilizes a heat map and histogram to review your totals/averages for each stage and groups them by job, pad, formation, fleet, or service company,
Job Totals summarizes multiple jobs by filtered info – annually, quarterly, and monthly totals while grouping by asset group, service company, fleet, formation, frac type, fluid type, or county, etc.
No matter what analytics you perform, don’t be hesitant to hone in on the outliers in your data and embrace them for refinement and growth! You won’t be disappointed.
Want to learn more?
-
- If you’re using Well Data Labs and would like a quick refresh on how to best utilize the tools for your frac reviews, then click here to schedule training.
- To see a demo of Well Data Labs, click here.
- To request a PDF of the case study mentioned above, click here