
Guest Post by Ky Kiefer
We often design hydraulic fracturing treatments around historical success. We look to the successes (and failures) of “wildcatters” of the past and attempt to replicate treatment designs. Once we have a baseline treatment that tends to perform within a formation, we strive for continuous improvement by adjusting our baseline treatment in controlled ways and, all the while, evaluating the efficacy of each adjustment. These kinds of experiments are conducted by scientists, engineers, and statisticians in the lab and field with tools such as Excel, SpotFire, proprietary simulation software, and various programming languages. However, the full power of data is just beginning to be leveraged industry-wide for two reasons:
- Powerful datasets take time to accumulate.
- The emergence of open-source tools (like Python and R) have leveled the playing field for advanced analytics among startups and supermajors alike.
Machine Learning — what’s all the hype about?
Machine learning and artificial intelligence (AI) have stirred up quite a bit of commotion lately, with mainstream news articles referencing Facebook’s chatbot AI being shut down for “creating its own language” and Elon Musk urging the UN to ban AI weapons.
We’re in an era where engineers are able to perform machine learning algorithms that learn patterns in data at a scale humans can’t fathom (e.g. processing 100+ million rows of data, synthesizing data in more than 3 dimensions, combining variables non-linearly). Robots have been taught to cook by watching YouTube, and computer vision models can now diagnose the recurrence of brain cancer with greater success than physicians. So it doesn’t seem outrageous to suggest that we could apply the same principles to generate novel, low-cost frac treatments with high production potential or use frac-van time series data to find pressure patterns indicating a potential screen out before even the most seasoned engineer or treater.
Well Data Labs is enabling leaders in the oil and gas industry to store and navigate their high-frequency data with ease, allowing completions engineers, geologists, and analysts to take the leap into advanced analytics and begin tip-toeing into the world of machine learning.
What are the practical applications of machine learning for our industry?
At this point, you may be thinking, “robots sure are cool, but my office doesn’t look like a scene out of Tron, so how does all of this apply to me?” The realm of machine learning already exists in oil & gas, and it isn’t limited to production optimization. Leaders in the field are predicting field equipment failure from vibrational data, creating vehicle routing optimization algorithms to prioritize which wells pumpers should travel to next, and using natural language processing to analyze engineer/treater notes to predict which well sites are high risk candidates for safety incidents.
Data science is moving the oil & gas industry from being reactive to proactive. But here’s the catch — we need people with oil & gas domain expertise building these algorithms! The oilfield is a complex and nuanced place and building predictive models and developing meaningful statistics is difficult without domain experience. Tools like Tableau will take you far, but if you’re looking to elevate your skillset, programming is a requirement. Python and R are the languages of data science, and getting started with them is easier than you’d think.
Python — you don’t have to speak parseltongue to understand it.
Python is a programming language, and within Python are modules. Modules are composed of code someone has written to make your life easier. For the Excel users out there, imagine having to write a VLOOKUP function with VBA code every time you wanted its functionality. Modules make it easy to perform common tasks in a few lines of code and are optimized for computation speed. Modules like pandas and scikit-learn can be leveraged to get started with data analysis and machine learning very quickly.
Using frac stage data extracted from Well Data Labs, in just a few lines of code we can look at the at the distribution of sand volumes pumped in gel-based treatments across formations (Niobrara, Codell, Wolfcamp). Click here to see the code!
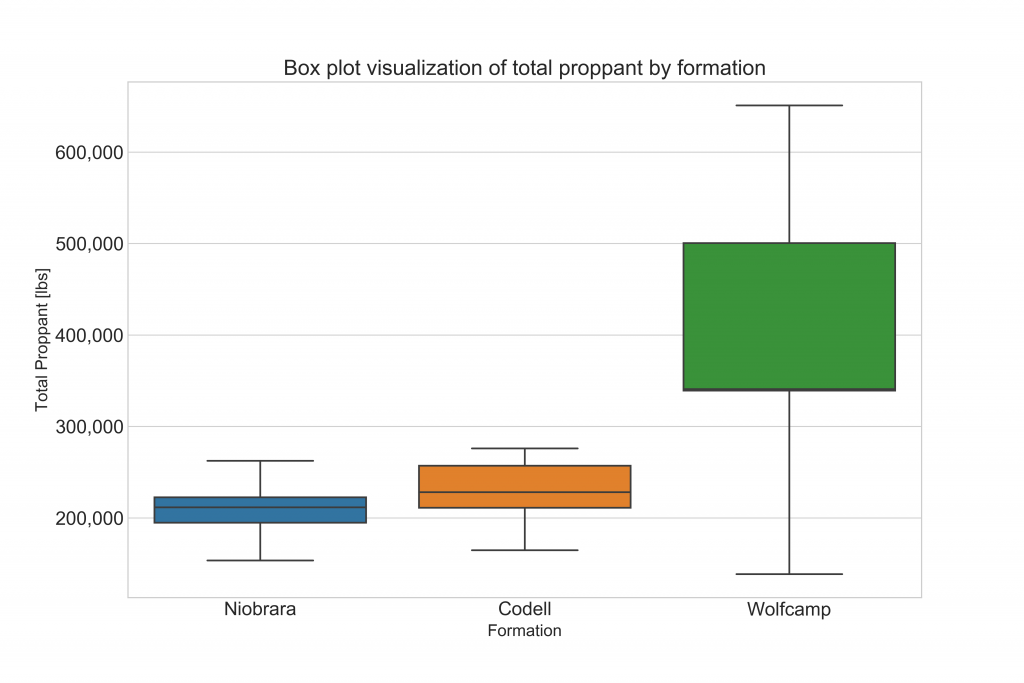
Figure 1: Box plot of the distribution of proppant pumped.
You may be familiar with box plots (also called box-and-whisker plots) in visualizing a distribution. Violin plots present a distribution in greater detail and allow you took look at details.
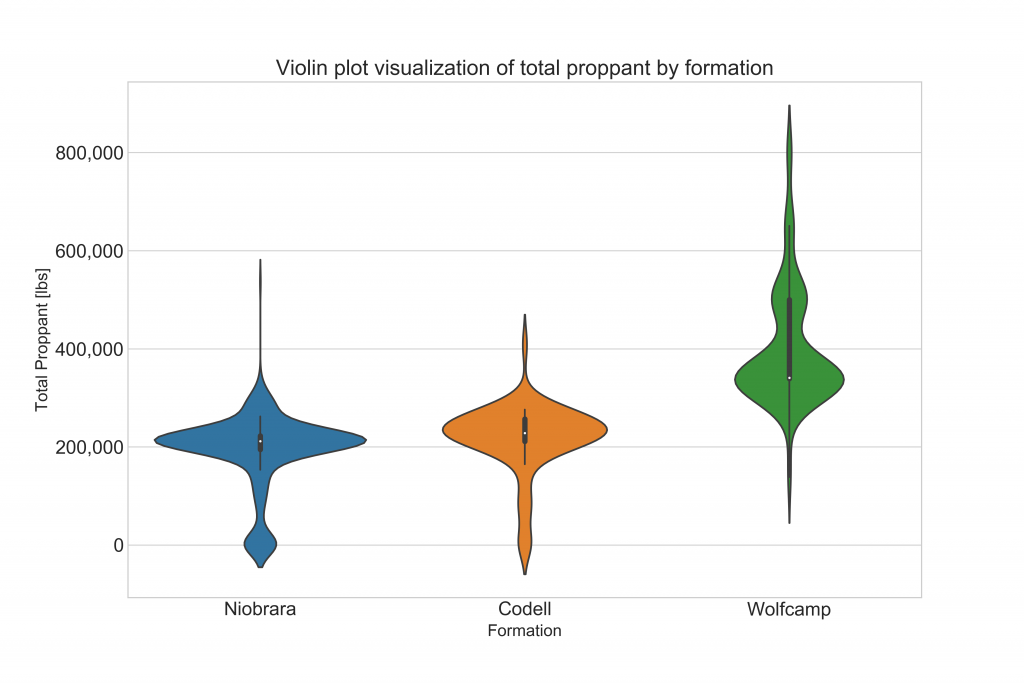
Figure 2: Violin plot of the distribution of proppant pumped per stage by formation.
Here’s a compelling visual why going beyond box plots might be a good idea for your dataset.
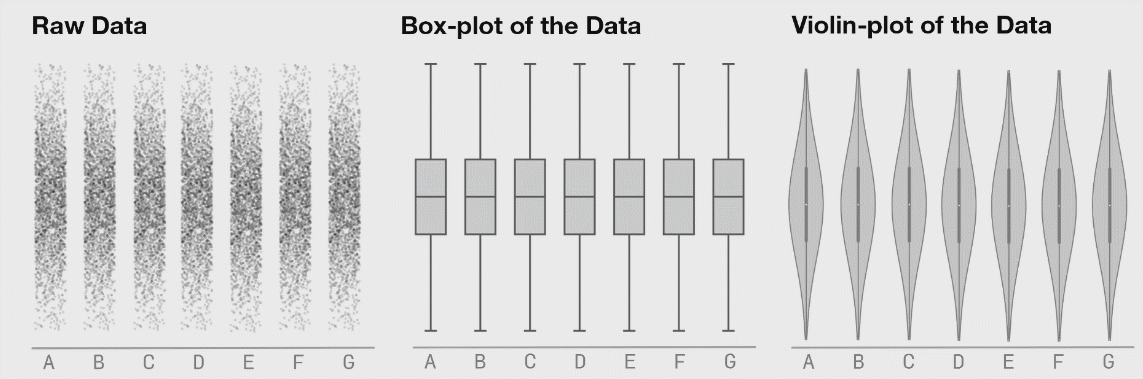
Figure 3: Seven distributions of data, shown as raw data points (or strip plots), as box plots, and as violin plots. Source.
Machine learning — it’s not science fiction, it’s just science
The bar to entry for advanced analytics has never been lower. The industry knowledge you’ve already worked to gain can now be combined with the same analytical tools being used by leading researchers around the world. The amount of data oil & gas companies collect and the high-stakes decisions that can be made from it make this industry one of the most exciting for data science and machine learning.
What tools are you using for data analysis? Try to replicate analysis you’ve done using Python, and share your data explorations with the team at @WellDataLabs.
Guest Post by Ky Kiefer
Ky is a data scientist with a background in hydraulic fracturing. He’s passionate about leveraging machine learning to drive outcomes in oil & gas, energy efficiency, and mental health. When not coding in Python, he’s most likely to be found trail running the Front Range.