I’m not an engineer. I was headed that way during my first year of undergrad at Virginia Tech’s College of Engineering, but I eventually yielded to the tempting promises of entrepreneurship proffered by the business school. Now, a decade later, I find myself leading business development for a tech company, but spending a significant portion of my time attending professional engineering lectures and trying to dissect and interpret fluid mechanics. I should have stayed in school…
I give you that background to let you know that when I started to regularly review treating plots for long lateral completions, my assumptions came without any true academic grounding. I knew I needed to buff up my knowledge base, so I turned to the SPE papers and journals and began my post-grad engineering education in the school of Reading A Lot of SPE Paper Abstracts, AKA, The Parts I Can Understand.
This past week, a single abstract blew my mind, and I would love to hear the thoughts, both affirming and dissenting, of other (real) engineers.
In SPE-179107, Jordan Ciezobka, Debotyam Maity, and Iraj Salehi posit that: “Rapid pump rate fluctuations induce a pressure pulse that tends to open previously unopened perforations and increase fracture complexity.” This seems crazy to me, and apparently to many engineers, because I am so used to equating clean-looking treating plots with ‘success’. They even note in the first line of their abstract that, “Typical hydraulic fracturing designs in shale utilize a predetermined fluid pump rate, which once achieved is held constant throughout the treatment.” In the Well Data Labs application I can quickly superimpose individual stage treating plots, and this typical pump design yields very attractive plots as each stage is completed to spec. They start to look like this:
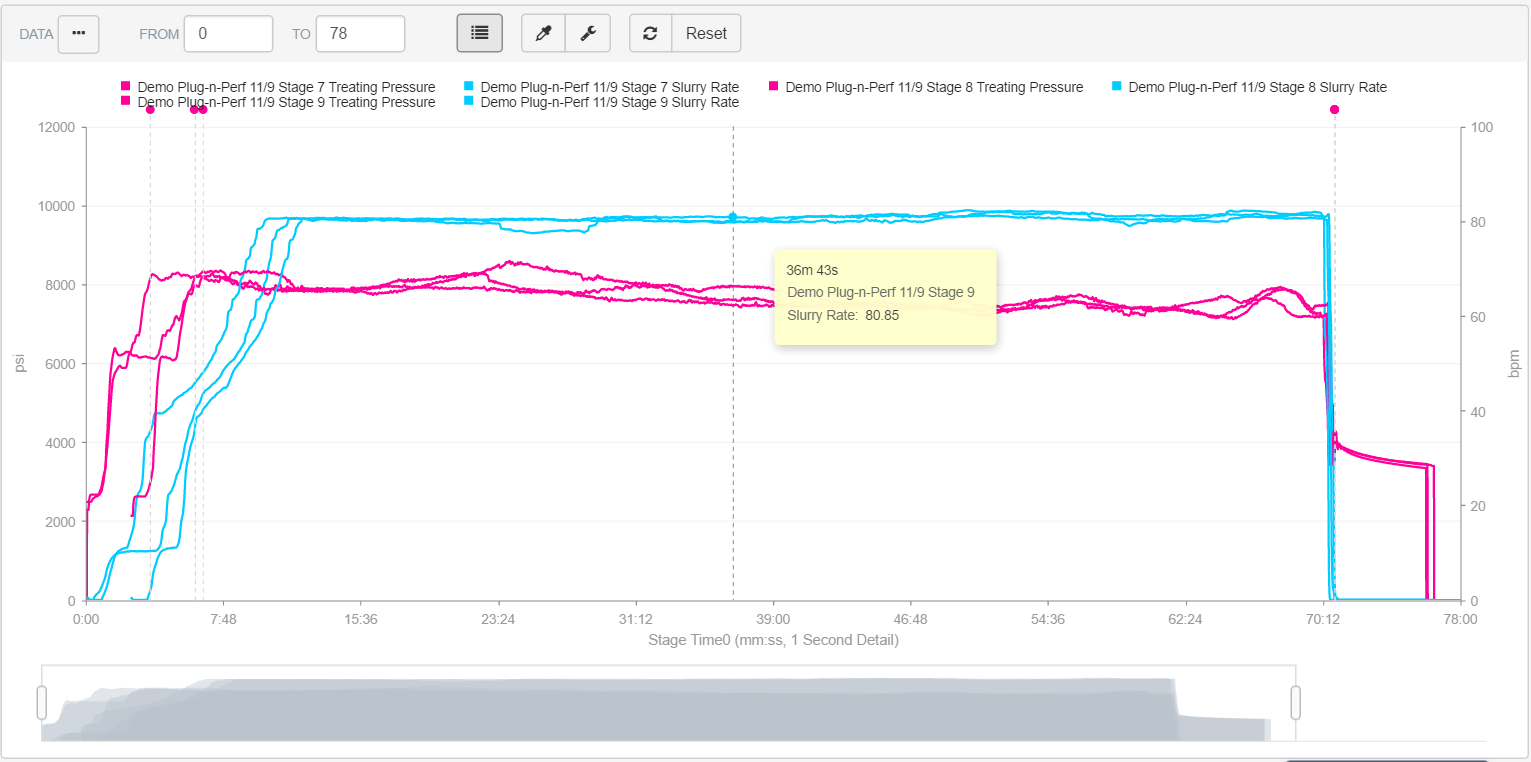
Source: Well Data Labs
Not being an engineer myself, it never crossed my mind that these clean looking graphs could actually be a sign of a non-optimal design. On their test wells in the Marcellus, the GTI team that wrote this paper found that their “variable pump rate fracture design” did lead to increased microseismic activity, which was correlative and indicative of increased production, to the tune of an 18% increase over stages without rapid rate fluctuations. And the best part? Music to everyone’s ears: “Implementation of the Variable Rate hydraulic fracturing method results in no additional costs while it increases stimulation efficiency.”
So, engineers who actually got their degrees; what do you think? Could graphs like the one below actually be a sign of a more optimal stage design than the pretty plots above? What other factors did the authors miss or decide not to include? Are ‘frac-factory’ completion designs closing the doors on experimentation? Comment below and start the conversation!
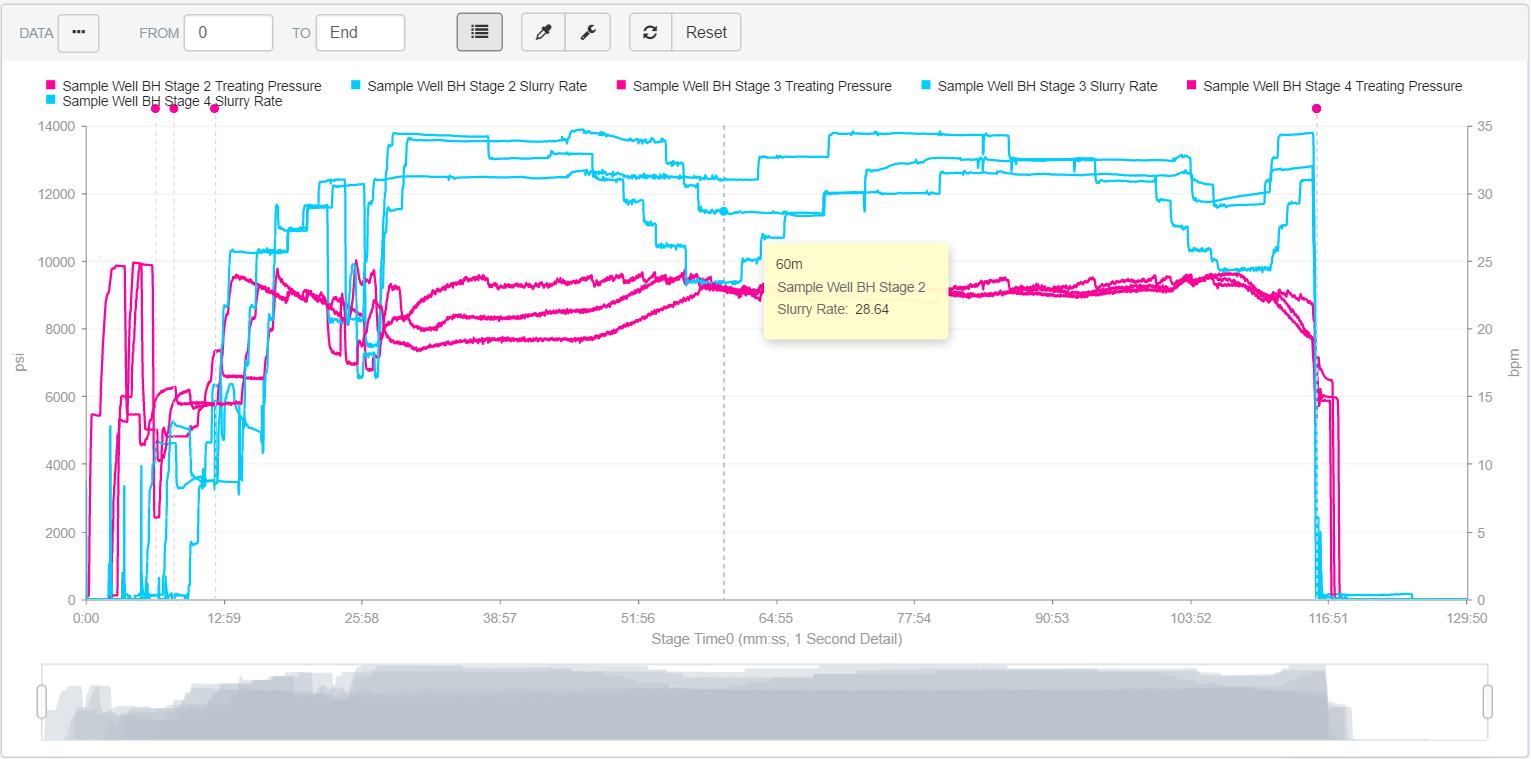
Source: Well Data Labs