
In today’s industry climate, operators are relying on large data sets more than ever to make intelligent design decisions when it comes to drilling and completing wells. The first step in making those decisions is establishing a detailed understanding of what happened in previously drilled wells. But, as any engineer who has attempted such an endeavor clearly knows, this is more easily said than done. Many of the data sets vital to understanding the full story of what happened on an old well are challenging to analyze, much less compare against each other. At Well Data Labs, we work to make one of these data sets, detailed frac data, structured and useful for engineers so that they can answer questions and gain the insight needed to do what they do best: design more efficient wells. To better understand what happens when engineers are armed with the right data, we sat down with Darren Kirkwood to discuss the analysis he was able to carry out on completions data using the Well Data Labs application during his time at Fuse Energy.
Q&A
What made you want to perform analysis on detailed, 1-second pumping data?
We were looking to evaluate the effectiveness of using biodiverter in our frac jobs. Biodiverter is a chemical that is pumped to block off some perforations in order to initiate more perforations so there should be a noticeable pressure increase when it is pumped into the wellbore. Biodiverter is fairly new, or at least it was new to us, so we wanted to be able to see if we were getting significant pressure increases and really try to understand what made for an effective biodiverter job. By looking at the completions data in one-second detail, we were able to see that in certain cases when the biodiverter was being pumped, we were not seeing any significant pressure responses and that made us want to think about why that was. We also wanted to see, when there was a pressure increase, how much of an increase should there be? Or in other words, what level of pressure increase is considered to be effective? We used the Well Data Labs app to map out the biodiverter pressure increases to see if they were happening or not, and if so, to what order of magnitude. With this data in hand, we could go back to our service company and try to figure out what level of responses we should be seeing and what happened when those responses were too weak or nonexistent.
Another thing we were interested in using this data for was in comparison with other detailed data sets like microseismic and chemical tracer data. We wanted to see if there was anything in the frac data, like ISIP, that we could use in conjunction with these other data sets. With the microseismic data, we were hoping to see what ISIP could tell us about what type of fracture we were looking at… was it a long, transverse fracture, or a larger area, more complex fracture? Then, using the chemical tracer data, we could determine which of those fracture types are contributing the most production.
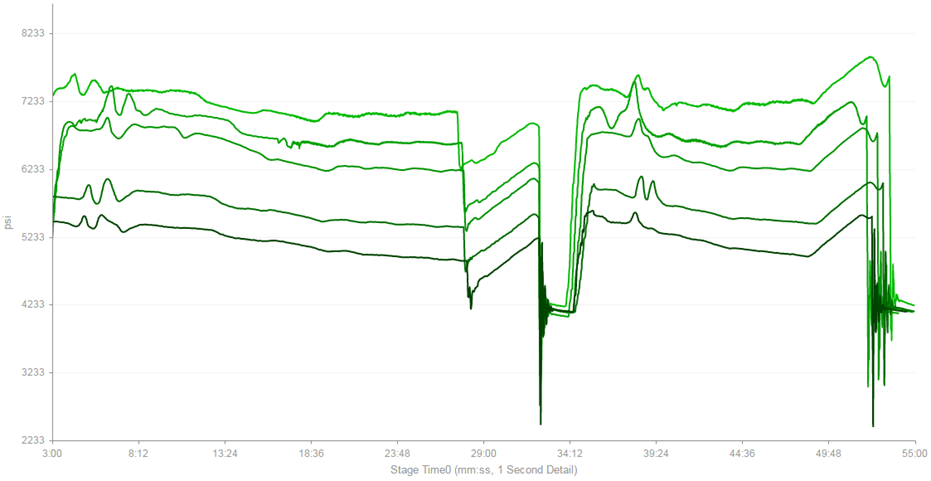
Well Data Labs 1-second Stage Comparison
What insights did you gain in comparing frac data with those other sets?
The particular wells I was looking at were in the Barnett and in that formation it’s typical with microseismic data to see both longer transverse fractures and complex fractures in the same wellbore. I was starting to see correlations between ISIP and fracture type. It looked like the longer fractures had lower ISIP, which makes sense because you probably had a preexisting point of weakness there. For the complex fractures, where you don’t have that existing point of weakness, it looked like there was a higher ISIP.
Were there any practical ways to apply that information?
Ideally you would use this information while pumping the frac job. After taking your initial ISIP by pumping a little fluid followed by a shutdown, you could determine if you wanted to pump that stage based on the ISIP measured. So, if you didn’t want the longer, transverse fractures, you wouldn’t pump a stage that showed a lower ISIP. For us, what we were really trying to determine was what, if anything could the ISIP tell us upfront that would affect how we pump future frac jobs.
For your role as a reservoir engineer specifically, what was the value of having access to detailed frac data?
The main value for me, really, was being able to compare frac data with all of my other data sets. Frac data is a piece to the puzzle that is important to bring together with all of your other data sets such as microseismic and tracer as well as production data to really give you the full story of what happened in that wellbore.
When using the app, what features did you find most useful?
First was being able to quickly pick ISIP’s, biodiverter pressure increases, and other unique events for all stages in a horizontal well using the job view function. Second was being able to compare those data stage to stage in the same well, and well to well in different wells using the job compare function. Lastly was comparing the per stage data in the job compare function to other data sets like chemical tracer and seismic.
Conclusion
We’re always interested to hear how engineers are making the most of their completions data with the Well Data Labs application and hope to feature more of these interviews on our blog in the future. If you’ve ever thought about what insights might be hiding in your frac data and would like to learn more about what we’re doing, we would love to chat with you. Give us a call at 720-662-7771 or send an email to sales@welldatalabs.com.